Pi’s value in rupiahs is a moving reference, not a fixed quote. It can change as market prices and currency exchange rates shift.
If you’re checking the value of your PI balance or comparing recent performance, a conversion figure is only a starting point. This guide explains how to convert PI into Indonesian rupiahs, review price movements, and understand factors that can affect the rate. It also distinguishes a reference conversion from a transaction amount, which depends on the quoted rate and transaction details. Treat each figure as a snapshot, and consider its timestamp and rate basis when assessing changes.
Key Takeaways
- Convert PI to IDR by applying the quoted rate to your PI amount, and keep the rate’s timestamp in view when comparing estimates.
- Review daily and weekly price changes together to distinguish short-term movement from a broader trend.
- Understand how PI market pricing, IDR exchange rates, and trading conditions can combine to move the conversion rate.
- Use Pi Converter to compare PI values in fiat currencies with a live market value, a community Stable Value, or a custom PI value.
How do I convert the price of PI to IDR?
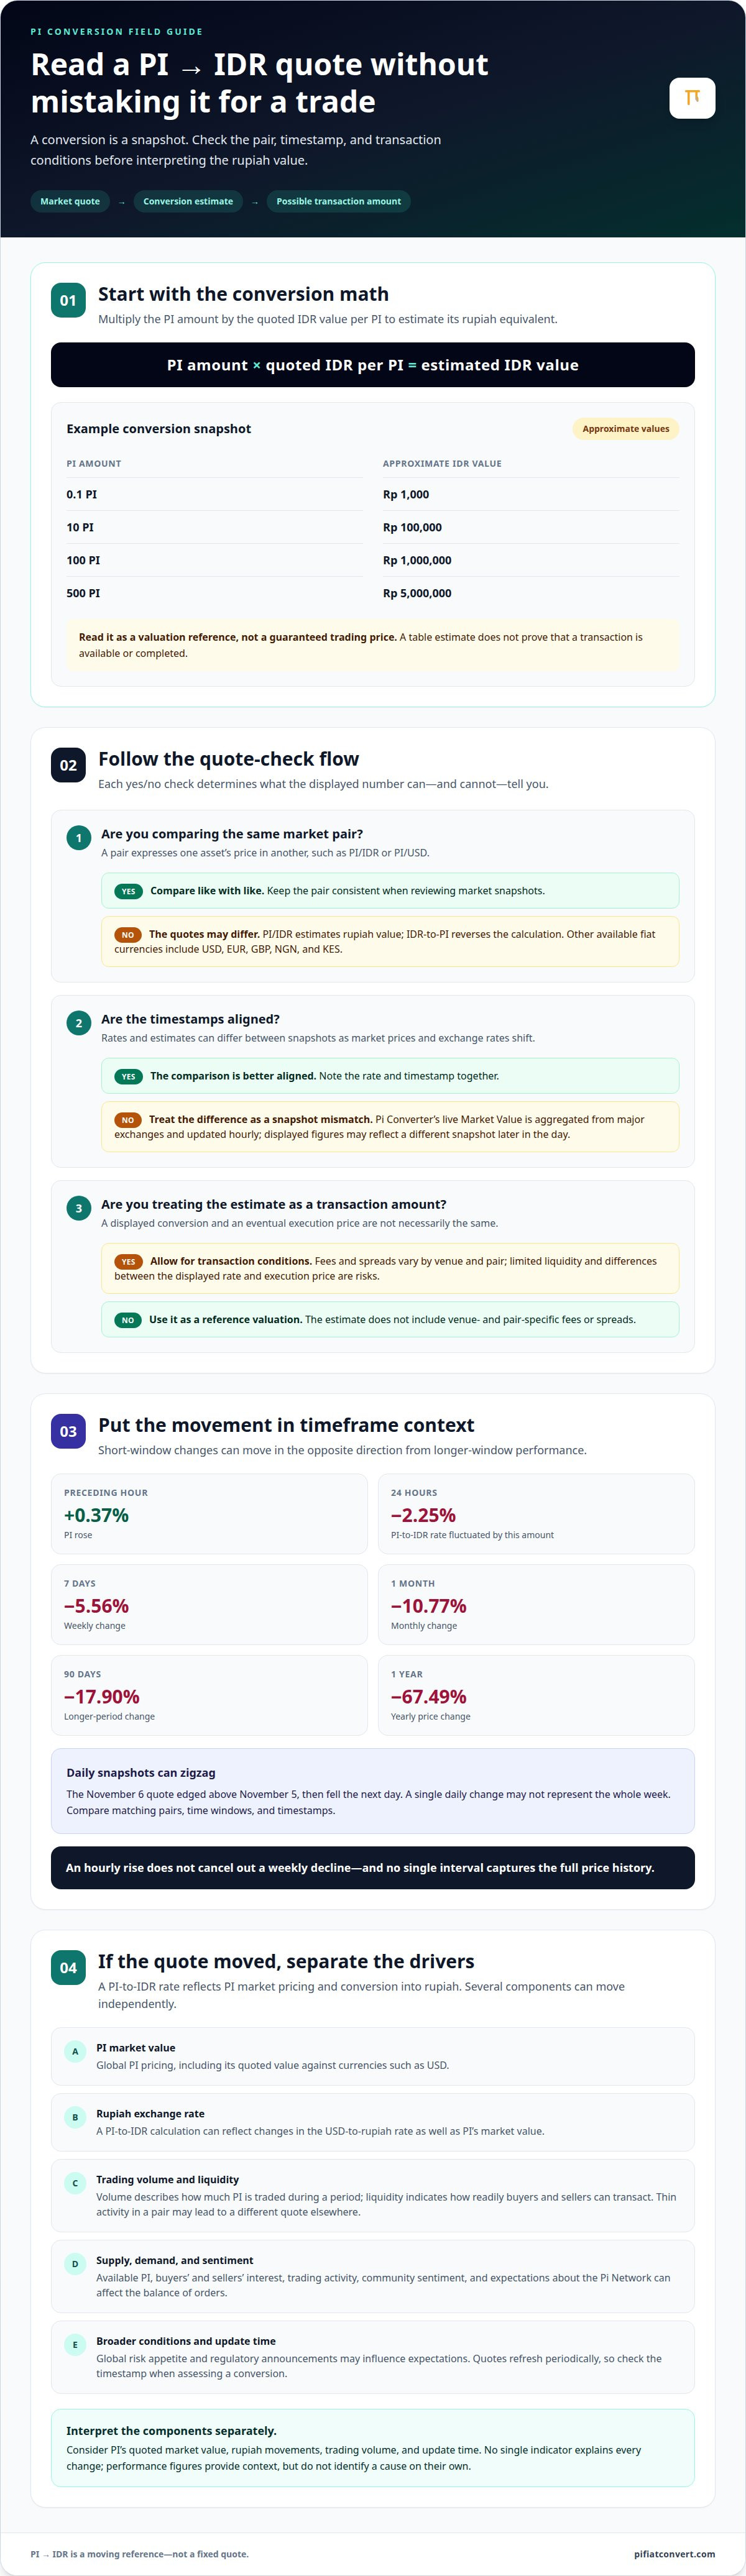
Multiply the PI amount by the quoted IDR value per PI to estimate its rupiah equivalent. To interpret the Pi to IDR market price today, check the rate and timestamp together, since estimates can differ between snapshots.
PI and IDR Conversion Examples
A Pi Converter table estimates a PI amount’s rupiah value at the displayed rate. One table snapshot gives these examples:
| PI | Approximate IDR value |
|---|
| 0.1 PI | Rp 1,000 |
| 10 PI | Rp 100,000 |
| 100 PI | Rp 1,000,000 |
| 500 PI | Rp 5,000,000 |
These figures show a conversion snapshot, not a guaranteed trading price. When using the Pi to IDR market price today, note the quote and its timestamp before comparing estimates.
Pi Network Market Pairs
A market pair expresses one asset’s price in another, such as PI/IDR or PI/USD. A PI-to-IDR table estimates the rupiah value, while an IDR-to-PI table reverses the calculation.
Pi Network conversions are also available in fiat currencies such as USD, EUR, GBP, NGN, and KES. Circulating supply and market activity inform pricing, but different PI pairs can show different quotes. Compare the same pair and timestamp when reviewing market snapshots.
Fees and spreads vary by venue and pair, and a conversion estimate does not include them. Risks when buying or selling PI in Indonesia include price volatility, limited liquidity in a particular pair, and differences between the displayed rate and the eventual execution price. A conversion table is a valuation reference, not proof that a transaction is available or completed.
How much has the price of PI changed over the last 7 days?
The seven-day change measures PI’s price movement across the previous week. PI prices can move over shorter intervals, so compare the same pair and timestamp when reviewing market snapshots.
Historical Prices and Daily Changes
Historical prices record PI’s quoted IDR value at specific dates or intervals. These daily rate snapshots show a downward movement:
| Date | PI price |
|---|
| November 4, 2026 |
| November 5, 2026 |
| November 6, 2026 |
| November 7, 2026 |
The November 6 quote edged above November 5, then fell the next day. This sequence shows why a single daily change may not represent the whole week. Compare the same currency pair and time basis when reviewing historical assets; otherwise, differences in quote timing can blur the trend.
Hourly and Daily Movements
Hourly and daily movements compare PI’s price over short windows, capturing near-term shifts rather than longer trends. PI rose 0.37% over the preceding hour, while its PI-to-IDR rate fluctuated by -2.25% over 24 hours.
Readings from different periods can point in opposite directions without contradicting one another. A mobile price display may update during the day, while a daily figure summarizes a broader interval. Check the timestamp before interpreting either movement.
Across timeframes, PI was down 5.56% over seven days and 10.77% over one month. The 90-day change was -17.90%, while its one-year price change was -67.49%. These comparisons put the latest exchange rate in context, but they don't identify a cause on their own.
Trading volume, available supply, and shifts in community sentiment can affect crypto prices. Regulatory announcements may also influence market expectations. To assess a change, compare matching time windows and consider whether trading activity or broader market conditions moved alongside the quote. An hourly rise does not cancel out a weekly decline, and no single interval captures the full price history.
What Influences the PI to IDR Exchange Rate?
A live PI-to-IDR exchange rate is the current quoted value of one PI in Indonesian rupiah. It reflects PI market pricing and the conversion between the asset’s quote currency and IDR, so changes in either can move the displayed rate.
Market volume is the amount of PI traded during a given period. Volume describes trading activity, while liquidity indicates how readily buyers and sellers can transact. If activity is thin in a particular pair, its quote may differ from rates elsewhere.
Global PI pricing also matters because PI can be quoted against currencies such as USD. A PI-to-IDR calculation can reflect both PI’s market value and changes in the USD-to-rupiah rate. If either moves, the IDR estimate can change even when the other stays stable.
Supply and demand describe how the available PI compares with buyers’ and sellers’ interest. Trading activity, market sentiment, and expectations about the Pi Network can influence the balance of orders. Broader conditions affecting crypto assets may matter too: shifts in global risk appetite can change demand without directly affecting the network.
Exchange-rate updates refresh the displayed quote periodically. Pi Converter’s live Market Value is aggregated from major exchanges and updated hourly, while conversions use current exchange rates. The displayed figure may therefore reflect a different snapshot later in the day. Compare the timestamp and pair when reviewing a rate, especially when assessing a deposit or planned conversion.
To interpret a PI/IDR movement, consider its components separately: PI’s quoted market value, rupiah movements, trading volume, and update time. No single indicator explains every change. Regulatory developments can affect market expectations, but their impact depends on participants’ responses and whether trading activity changes alongside the news.
Pi price performance describes how PI’s market value changes over selected timeframes. Comparing weekly ranges with longer-term reference points helps distinguish recent movement from broader historical context.
That range shows the spread between the week’s lowest and highest listed PI-to-IDR prices, not the value of every transaction during that period. A current quote within the range is a snapshot; the range shows how far the rate moved.
Longer historical markers provide additional context. These figures describe different periods: the 90-day change captures a recent interval, while the all-time high marks a historical peak. Neither alone indicates what the rate will do next.
Conversion expresses a PI amount in another currency using a selected exchange rate. To convert Pi Network into Indonesian rupiah, multiply the PI amount by the PI-to-IDR rate. The result changes with the rate, so the same PI balance can produce different IDR estimates at different times. A conversion rate is a calculation reference, not a record of a completed transaction.
Circulating supply is the amount of PI reported as circulating in the market; it was listed at 11,359,769,094 PI on November 8, 2026. Supply can help frame market context, but price performance also reflects demand and trading activity. Bitcoin may influence broader crypto sentiment, while PI’s own market conditions remain relevant. Review the timeframe and currency pair before drawing conclusions from a chart or comparing investment performance.
For a quick estimate across currencies, convert PI to IDR using a chosen value basis, then compare it with the period you’re assessing. This keeps the conversion and performance timeframe aligned.
Pi Converter
Pi Converter helps you estimate Pi’s value in IDR and other fiat currencies. Use it to compare a PI amount across currencies or review different valuation bases. Choose the community Stable Value, live Market Value, or a custom PI value, then convert using current exchange rates. The live Market Value is aggregated from major exchanges and updated hourly, giving you a reference to compare with the rate snapshot you’re reviewing.
For a broader comparison, conversions are also available in USD, EUR, GBP, NGN, KES, and more than 100 other currencies. A converter provides an estimate for reference; it doesn’t execute a transaction. For questions about using Pi Converter for a PI-to-IDR estimate, contact Pi Converter.
Make Your Next Conversion Decision Deliberately
A price reference is most useful when it supports a consistent decision process. Before acting, decide whether you need the conversion to estimate a balance, compare currencies, or review a potential transaction. Keep that purpose and the rate’s timestamp in view to avoid mistaking a reference value for a transaction outcome.
The Pi to IDR market price today can change, so treat any displayed figure as a time-specific input, not a standing valuation. To track PI over time, use the same currency pair and comparable intervals. This makes changes easier to interpret without assuming they predict future movement.
For help using Pi Converter to estimate PI values in fiat currencies, contact Pi Converter for conversion assistance. A clear conversion reference can make your next step more informed and measured.
Frequently Asked Questions
How much is 1 Pi Network worth in IDR?
For the Pi to IDR market price today, treat that figure as a snapshot rather than a fixed value. Another listed table gives 10 PI as , showing how estimates can vary between displayed rates.
How many PI can I buy for Rp1?
At a listed conversion rate, Rp1 equals 0.0007542317 PI. This reverse conversion estimates the PI equivalent of one rupiah. To calculate a different amount, multiply the rupiah value by the same rate. The result is a conversion estimate, so use the quoted rate and its timestamp consistently when comparing amounts.
One IDR is listed as 0.0007542317 PI. That is a fractional PI amount, rather than one whole coin. These figures show how the reverse conversion scales, but they don’t confirm that a purchase has taken place.
What does PI to IDR conversion rate mean?
The PI-to-IDR conversion rate shows how many Indonesian rupiahs correspond to one PI at a given quote. The rate is an input for calculation; it does not establish the final value of a completed transaction.
What is the current Pi Network (PI) price in Indonesian rupiah (IDR)?
Another snapshot lists 10 PI as . For the Pi to IDR market price today, use the conversion rate shown at the moment you need the estimate and note its timestamp.
What is the PI to IDR exchange rate today on major cryptocurrency exchanges?
Pi Converter’s live Market Value aggregates prices from major exchanges and updates hourly. Compare the PI/IDR pair and quote time when reviewing rates, since snapshots may differ. A displayed conversion estimate is informational and does not execute a trade.